A mushroom forecast for Catalonia, species by species: a Rust server that turns public terrain, forest and weather data into a growth index every 57 metres, and serves it as a map.
StatusIn production
StartedOctober 2026
StackRust · axum · Leaflet
What it is
Overview
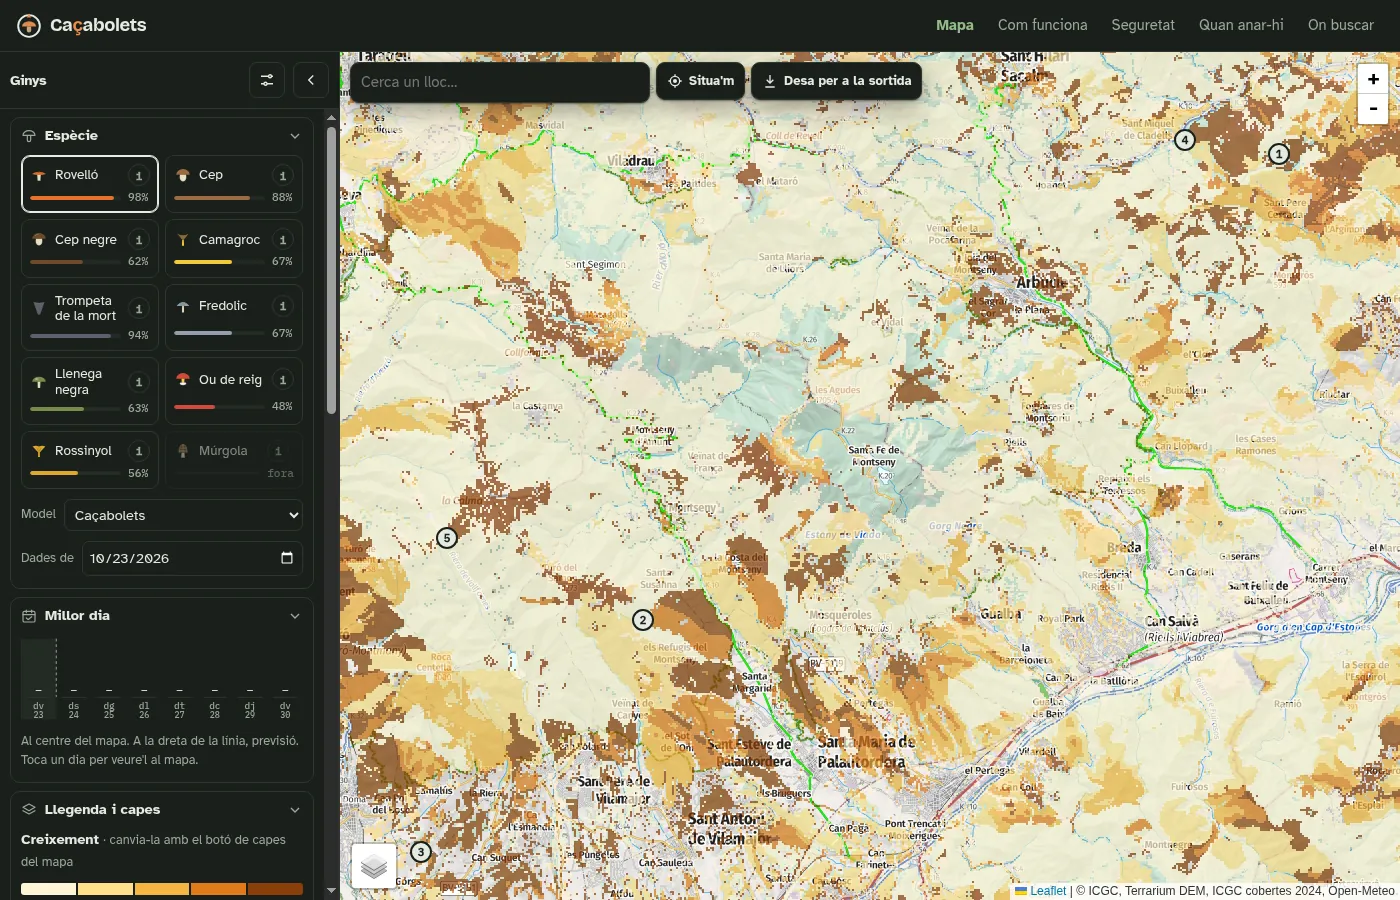
Every autumn half of Catalonia asks the same question: is it worth going this weekend, and where? This answers it for ten species, from rovelló to camagroc, on a map you can open on a phone in the car park.
For every pixel — about 57 metres on a side — it combines elevation, slope and aspect from terrain tiles, the forest type from the Catalan land-cover map, and the rain and temperature of the past weeks plus the forecast. Each species has its own tree, its own altitude band and its own rain window, so the index is per species, not one blob of "mushrooms". It runs two models side by side: its own, and a reproduction of an existing public forecast kept as the baseline to beat. Its own is checked against recorded finds.
No accounts. Anyone can report "found it" or "nothing there", and leave an alert that pings their phone when a spot reaches a level. Open the map →
How it evolved
Arc
One weekend to a working map. It began as a script that queried an existing forecast, then became a server computing its own index from raw public data, with a seven-day forecast, soil moisture and data layers to see why a pixel scores what it scores.
Then it had to be fast. A fresh tile meant downloading terrain, cover and weather and computing 65,000 pixels; a view needs sixteen. The arithmetic got five times cheaper, tiles five times smaller with a six-colour palette, and the whole of Catalonia is now computed ahead of time, three times a day — each run built aside and served only once complete, so the map never has holes.
Then it had to survive being public. With no accounts, the server protects itself: limits per address, at most two computations at once, dates and area bounded. And the model grew people: walking time from the nearest road, holidays and long weekends, and picking that starts the day mushrooms appear — because the best spot an hour from the car is not the best spot by Sunday afternoon.
Screens
Interface
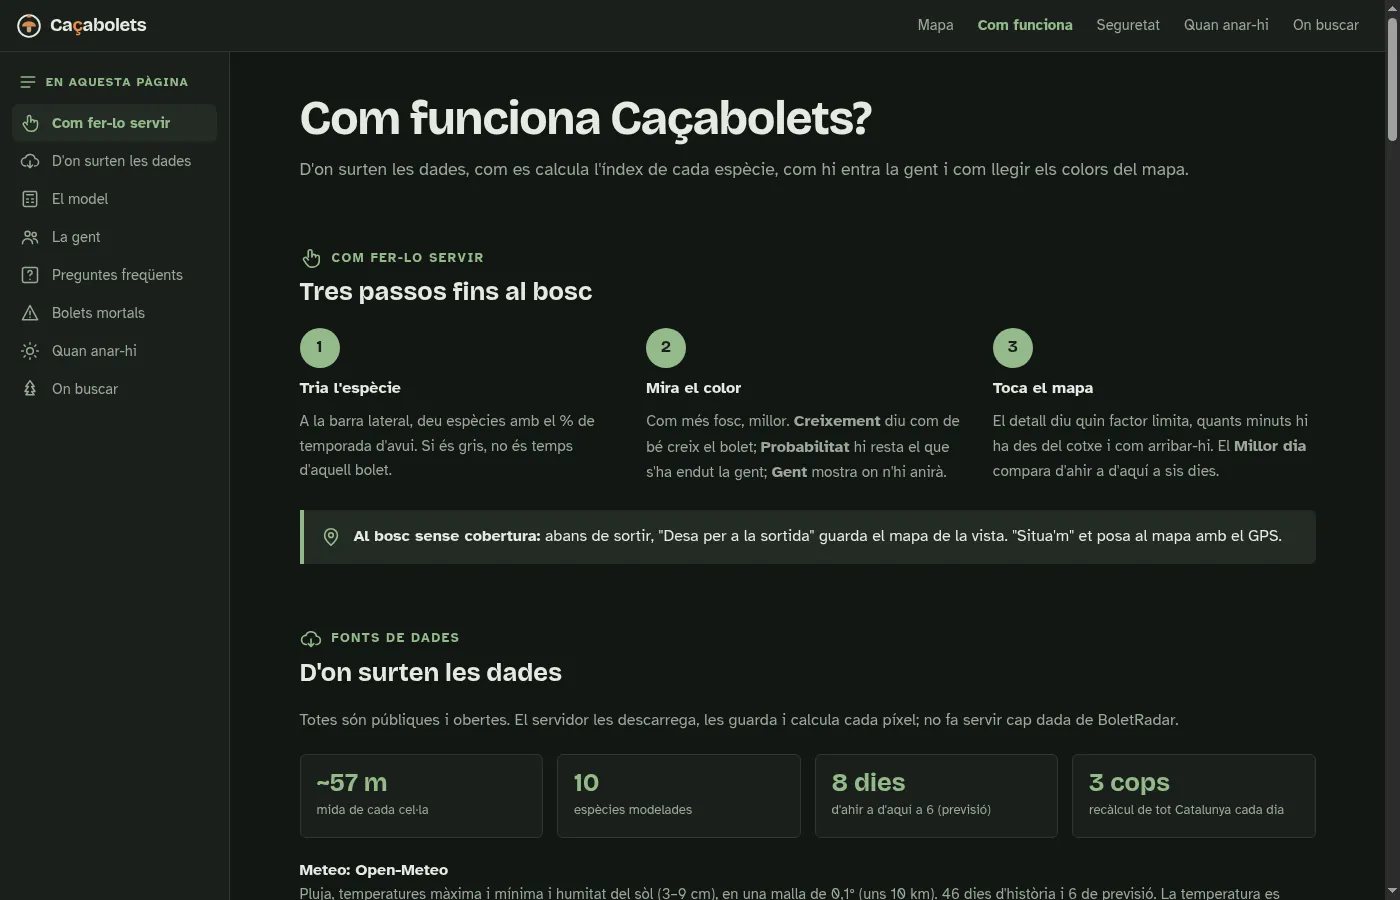
The forecast for one species, with each species’ share of its season in the sidebar.How it works: where the data comes from, the model, and the people in it.
Changelog
Newest first
October 2026
2026-10
Three runs a day Infra
Observed rain from the regional weather service on top of the model data, the host tree of each species read from the forest map, and three forecast runs a day — each computed aside and swapped in only when complete.
2026-10
People in the model Feature
A stock model, day by day: walking time from the car, demand on holidays and long weekends, and picking that starts when mushrooms appear. The same spot scores lower on Sunday evening than on Friday.
2026-10
Ready to be public Security
Limits per address, a cap of two computations at once, burned and protected areas on the map, reports of finds, alerts to the phone, installable as an app, and the model validated against recorded occurrences.
2026-10
A map that opens at once Infra
Computation five times faster, tiles five times smaller, weather fetched incrementally per node under one rate limiter, and the whole region warmed in advance.
2026-10
An index per species Start
A Rust server computing a growth index per species from terrain, forest cover and weather, served as map tiles, with a seven-day forecast.